The Environmental Protection Agency's most recent Drinking Water Infrastructure Needs Survey and Assessment puts the price tag at $625 billion — the total investment required over the next 20 years to maintain, repair, and upgrade America's drinking water systems. A separate EPA assessment of clean water (wastewater and stormwater) infrastructure adds another $434 billion, bringing the combined water infrastructure need to $1.06 trillion.
These figures represent the most authoritative accounting of America's water infrastructure deficit, derived from engineering assessments of over 73,000 water systems serving more than 320 million people. The numbers tell a different story than the daily experience of most Americans, who turn on a tap and get clean water without thinking about the century-old pipes delivering it.
How Old Are America's Water Pipes?
The average age of a water main in the United States is 45 years, according to the American Water Works Association (AWWA). But that average conceals a bimodal distribution — approximately 35% of the nation's water mains were installed before 1960 and are now more than 65 years old, while many newer systems built during suburban expansion in the 1990s and 2000s are still within their first few decades of service.
The oldest systems in the Northeast and Midwest contain pipes dating to the late 1800s. Cities including Boston, Philadelphia, Detroit, and Chicago have documented water mains that are over 100 years old and still in active service. New York City's water distribution system includes approximately 6,800 miles of mains, with an average age of 69 years, according to the NYC Department of Environmental Protection.
Cast iron mains — the predominant material used from the 1880s through the 1960s — have a typical service life of 75 to 100 years, according to AWWA. The enormous volume of cast iron pipe installed during the post-war building boom is now reaching end of life simultaneously, creating what utility engineers call a "replacement cliff."
The American Society of Civil Engineers estimates that a water main breaks somewhere in the United States every two minutes, resulting in approximately 240,000 breaks per year. Each break wastes an average of 1,700 gallons of treated water per minute until repaired, contributing to the estimated 6 billion gallons of treated water lost daily through leaks, breaks, and failing infrastructure, according to AWWA.
The EPA Needs Survey: Where the $625 Billion Goes
The EPA's $625 billion drinking water infrastructure need breaks down into five major categories:
Transmission and distribution accounts for the largest share at $386 billion (61.8% of total need). This category covers the replacement and rehabilitation of water mains, valves, hydrants, and service connections — the buried infrastructure that delivers water from treatment plants to customers.
Treatment plant upgrades represent $83 billion (13.3%), including new treatment capacity, process upgrades to meet tightening regulatory standards, and replacement of aging equipment. Emerging contaminant treatment — particularly PFAS — is driving a growing share of treatment investment.
Storage facilities (tanks, reservoirs, and standpipes) account for $49 billion (7.8%). Many of the nation's 154,000 water storage structures are past their useful life, with concrete deterioration, coating failures, and capacity inadequacy the most common deficiencies.
Source water development represents $38 billion (6.1%), primarily for new wells, intake structures, and source water protection. Western states facing groundwater depletion and surface water shortages account for a disproportionate share.
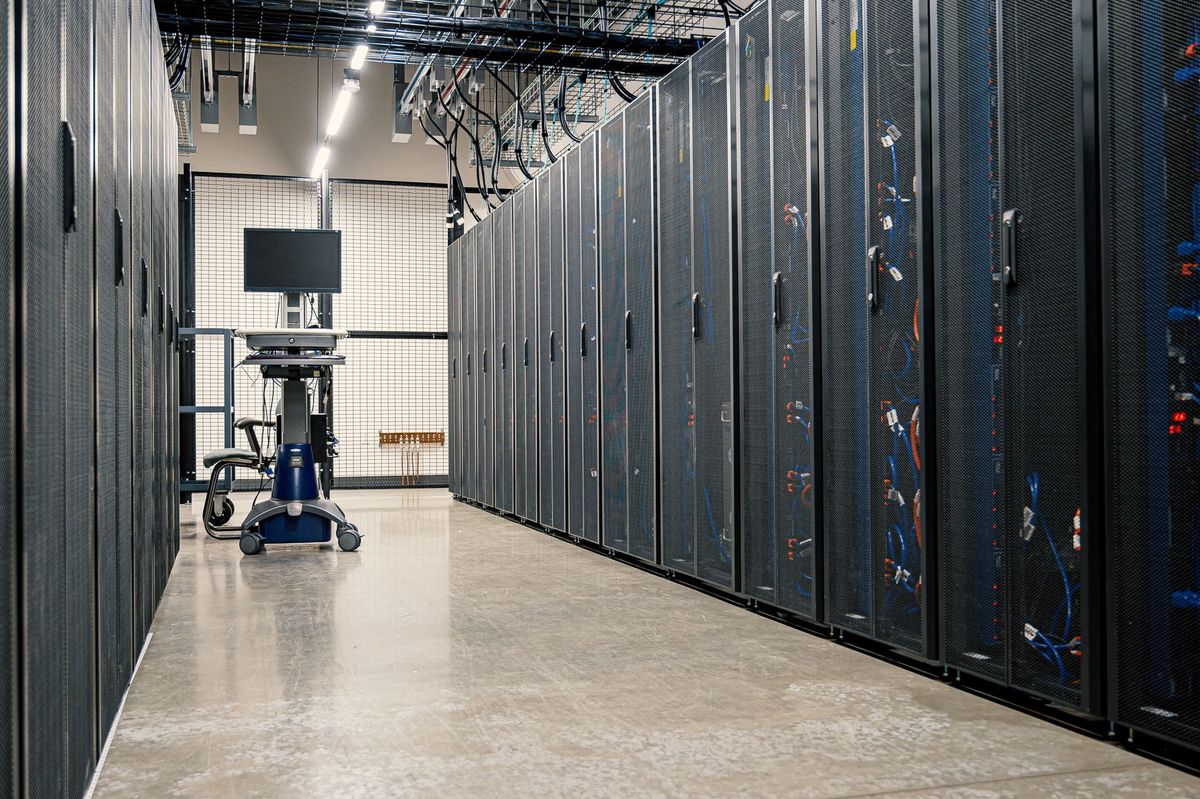
Other infrastructure — including meters, SCADA systems, security improvements, and emergency interconnections — comprises the remaining $69 billion (11%).
Lead Pipe Replacement: The $45 Billion IIJA Commitment
The most politically visible element of the water infrastructure crisis is lead service lines. The EPA's revised Lead and Copper Rule (LCR), finalized in October 2024, requires all water systems to identify and replace 100% of their lead service lines within 10 years.
According to EPA estimates, approximately 9.2 million lead service lines remain in the United States, connecting water mains to homes and buildings built before 1986 (when lead pipes were banned for new construction). The highest concentrations are in older industrial cities — Chicago alone has an estimated 400,000 lead service lines, more than any other US city, according to the city's lead pipe inventory.
The IIJA allocated $15 billion specifically for lead service line replacement through the Drinking Water State Revolving Fund, plus an additional $11.7 billion in general drinking water SRF funds that can also be used for lead line work. Combined with the $15 billion EPA lead pipe replacement initiative announced in 2024, total federal commitment exceeds $45 billion.
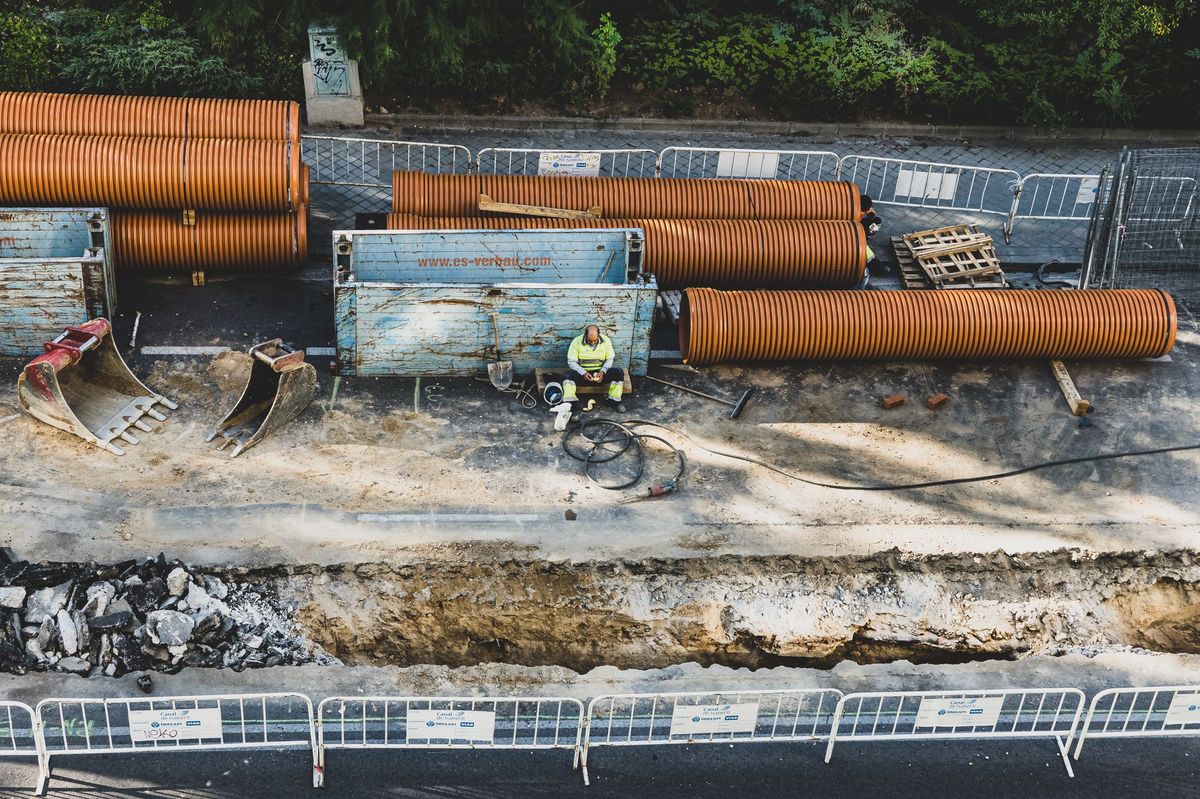
The construction scope is enormous. Each lead service line replacement involves excavating and replacing the pipe from the water main (typically in the street) to the building's interior plumbing connection, a distance of 30 to 80 feet depending on lot depth. According to EPA data, the average cost per lead service line replacement is $4,700, though costs range from $2,500 in areas with accessible soil to $12,000 or more in areas with rocky conditions, deep frost lines, or complex utility conflicts.
At 9.2 million lines and $4,700 average cost, the total national lead pipe replacement cost is approximately $43.2 billion — closely matching the federal commitment but leaving minimal margin for the cost overruns that are common in underground utility work.
State-by-State Funding Gaps
Federal funding covers only a portion of the $625 billion need. State revolving fund programs, municipal bonds, and rate increases must fund the balance. According to the Association of State Drinking Water Administrators, the combined federal and state SRF funding for drinking water infrastructure averaged $8.4 billion per year from 2022 to 2025 — a significant increase over pre-IIJA levels but still insufficient to address the full 20-year need.
At $8.4 billion per year, cumulative SRF funding over 20 years would total $168 billion — covering just 26.9% of the $625 billion EPA-estimated need. The remaining $457 billion must come from local utility capital budgets, municipal bonds, and private investment.
States with the largest identified water infrastructure needs, according to EPA survey data, include:
- Texas — $47.3 billion (7.6% of national need, reflecting rapid population growth straining existing systems)
- New York — $42.8 billion (aging Northeast infrastructure)
- California — $39.1 billion (earthquake resilience and source water challenges)
- Ohio — $28.6 billion (legacy industrial city infrastructure)
- Pennsylvania — $25.4 billion (widespread lead service lines and aging mains)
Small and rural water systems face the most acute funding challenges. According to EPA data, systems serving fewer than 10,000 people account for 97% of all community water systems but serve only 20% of the population. These systems have the weakest rate bases and the least access to municipal bond markets, making them disproportionately dependent on federal and state grant programs.
PFAS Contamination: The Emerging Cost Driver
Per- and polyfluoroalkyl substances (PFAS) contamination has rapidly become one of the most significant cost drivers in water infrastructure. In April 2024, EPA finalized Maximum Contaminant Levels for six PFAS compounds, establishing enforceable limits of 4 parts per trillion for PFOA and PFOS — extraordinarily low thresholds that require advanced treatment technologies.
According to AWWA, compliance with the final PFAS rule will require treatment upgrades at an estimated 6,000 to 10,000 water systems nationally. The two primary treatment technologies — granular activated carbon (GAC) adsorption and anion exchange — require significant capital investment:
- GAC treatment systems cost $1.5 million to $15 million per installation depending on system size, with ongoing carbon replacement costs of $500,000 to $2 million annually, according to the Water Research Foundation.
- Anion exchange systems cost $2 million to $20 million with lower ongoing costs but more complex waste disposal requirements.
AWWA estimates the total 20-year cost of PFAS compliance at $57 billion — an expense not fully reflected in the EPA's needs survey, which was conducted before the final PFAS rule was issued.
The construction demand is immediate. EPA's compliance timeline requires all affected systems to install PFAS treatment by 2029, creating a compressed construction window. Firms specializing in water treatment plant construction and process mechanical work are seeing backlogs extend to 18 to 24 months.
Workforce Needs: 800,000 Workers by 2035
The water sector faces a workforce crisis that compounds the infrastructure challenge. According to the Brookings Institution and AWWA, the US water and wastewater utility sector employs approximately 660,000 workers. An estimated 30 to 50% of the current workforce is eligible to retire within the next 10 years, according to AWWA workforce surveys.
Replacing retirees and staffing new infrastructure projects will require approximately 800,000 total workers by 2035, according to Brookings projections. The shortage is most acute in licensed water treatment operators (who require state certification), pipeline workers, and instrumentation and controls technicians.
According to BLS data, water and wastewater treatment plant operators earned a median annual wage of $51,600 in 2025. Pipeline construction laborers earned $38,500, and water utility maintenance workers earned $44,200. These wages, while improved from a decade ago, still lag behind comparable positions in the oil and gas, electrical, and general heavy construction sectors.
States are responding with workforce development programs. The Water Environment Federation's Water Workforce Initiative has enrolled 12,000 participants since 2022. California's Water Utility Apprenticeship Program, launched in 2024, has 1,400 active apprentices across 45 utilities.
The Wastewater Side: Another $434 Billion
The drinking water infrastructure deficit is paralleled by an equally severe wastewater crisis. EPA's Clean Watershed Needs Survey estimates $434 billion in wastewater and stormwater infrastructure needs over 20 years.
Combined sewer overflow (CSO) remediation accounts for $58 billion of the wastewater need. Approximately 860 communities in 27 states operate combined sewer systems that discharge untreated sewage into waterways during heavy rain events. EPA consent decrees requiring CSO remediation are driving massive tunnel, storage, and treatment construction projects in cities including Indianapolis ($2.5 billion), Cleveland ($3.4 billion), and Washington, DC ($2.7 billion).
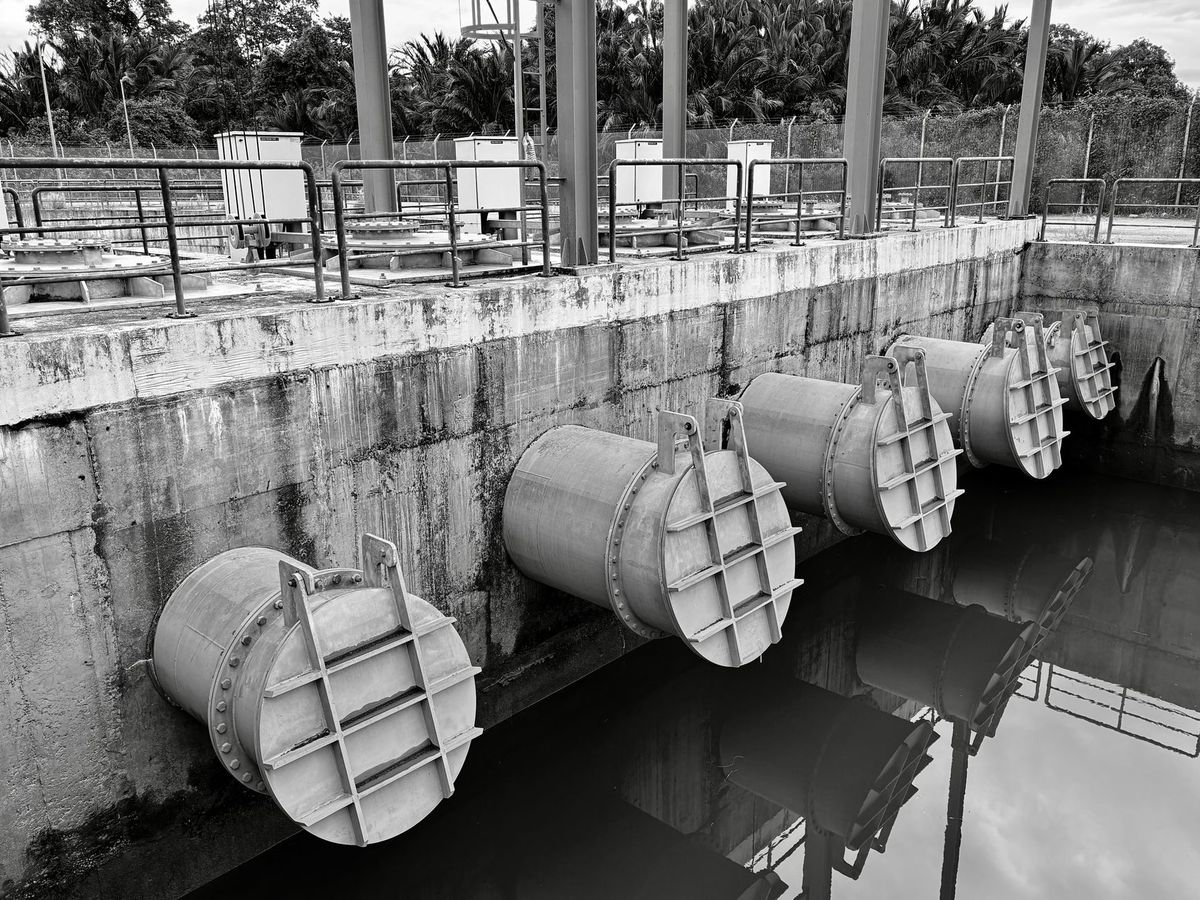
Wastewater treatment plant upgrades account for another $76 billion, driven by nutrient removal requirements (nitrogen and phosphorus), capacity expansions, and energy efficiency improvements. The trend toward water reuse — treating wastewater to potable or near-potable standards — is adding construction demand in water-stressed regions. The WateReuse Association reports that 91 potable reuse projects are in planning or construction nationally, with a combined construction value exceeding $12 billion.
Climate Resilience and Extreme Weather
Climate change is accelerating water infrastructure deterioration and increasing the urgency of investment. According to the National Oceanic and Atmospheric Administration, the US experienced 28 billion-dollar weather disasters in 2025, many of which caused significant damage to water and wastewater infrastructure.
Flooding, the most costly natural hazard for water systems, damaged or destroyed water infrastructure in 14 states in 2025 alone, according to FEMA damage assessments. Hurricane and flood damage to water treatment plants averaged $180 million per major event, according to AWWA data.
Drought is equally destructive. Western water utilities are investing billions in resilience measures including aquifer storage and recovery, desalination, and interconnection with neighboring systems. The Metropolitan Water District of Southern California's $3.4 billion Regional Recycled Water Program — the largest potable reuse project in the world — broke ground in 2025 and will produce 150 million gallons per day of purified water by 2032.
What Contractors Should Do Now
The water infrastructure construction market will exceed $40 billion per year through at least 2035, driven by lead pipe replacement mandates, PFAS treatment requirements, and aging system rehabilitation. Contractors seeking this work should take one specific step now: pursue prequalification with your state's Drinking Water and Clean Water State Revolving Fund programs. SRF-funded projects represent the most reliable pipeline of water construction work, and prequalification applications typically require 60 to 90 days to process. States are releasing record SRF funding allocations for fiscal year 2027 project solicitations beginning this fall — contractors who prequalify now will be positioned to bid when those solicitations open.
Frequently Asked Questions
How much does the US need to spend on water infrastructure?
According to the EPA's most recent needs surveys, the US requires $625 billion for drinking water infrastructure and $434 billion for wastewater and stormwater infrastructure over the next 20 years — a combined need of $1.06 trillion. The largest single category is transmission and distribution pipe replacement at $386 billion.
How many lead pipes are still in use in the US?
The EPA estimates approximately 9.2 million lead service lines remain in the United States. Chicago has the most at 400,000. The revised Lead and Copper Rule requires all water systems to replace 100% of their lead service lines within 10 years, at an estimated national cost of $43.2 billion.
What is driving increased water infrastructure spending?
Three primary factors are driving spending: the aging of post-war era water mains (average pipe age is 45 years nationally), EPA's PFAS maximum contaminant levels requiring treatment upgrades at 6,000 to 10,000 water systems by 2029, and IIJA funding of $55 billion for water infrastructure — the largest federal water investment in history.