Municipal and state spending on bicycle and micro-mobility infrastructure construction has reached $3.8 billion in active projects across the United States, driven by a combination of federal IIJA funding through Transportation Alternatives and PROTECT programs, state and local bond measures dedicated to active transportation, and growing demand from cities seeking to reduce traffic congestion, improve air quality, and provide equitable transportation options.
The numbers tell a different story than the culture-war framing that often surrounds bike infrastructure debates. For construction firms, bike infrastructure represents a growing and technically diverse market segment that includes protected bike lane construction, multi-use trail building, intersection reconstruction, bridge and overpass projects, and supporting facilities like bike parking structures and maintenance stations.
Spending Breakdown
The $3.8 billion in active bike infrastructure construction breaks down across several project categories:
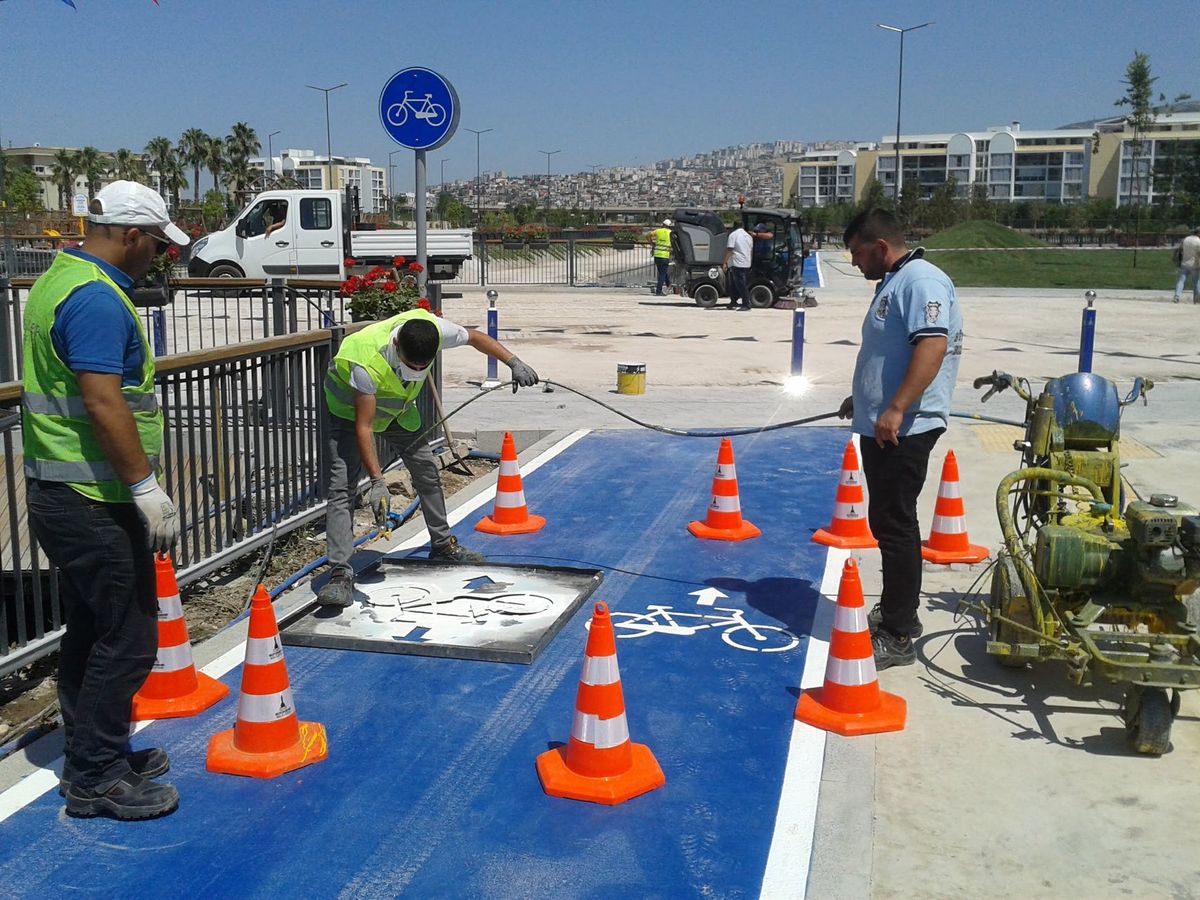
Protected Bike Lane Construction: $1.2 billion. Protected bike lanes (also called cycle tracks or separated bike lanes) involve physical separation between cyclists and motor vehicle traffic using concrete curbs, bollards, planters, or parked cars. Construction requires lane restriping and reconfiguration of existing roadways, installation of physical separation elements (concrete curbs at $40 to $80 per linear foot, bollard systems at $200 to $500 per bollard), signal modifications at intersections including dedicated bicycle signal phases, drainage modifications to accommodate new curb lines, and surface treatments (colored pavement, thermoplastic markings) for conflict zones. The average cost for protected bike lane construction is $1.2 to $2.5 million per mile in urban areas, depending on the extent of roadway reconstruction required. Simple restriping with bollard protection costs $200,000 to $500,000 per mile, while full reconstruction with raised curbs, drainage modifications, and signal upgrades can exceed $4 million per mile.
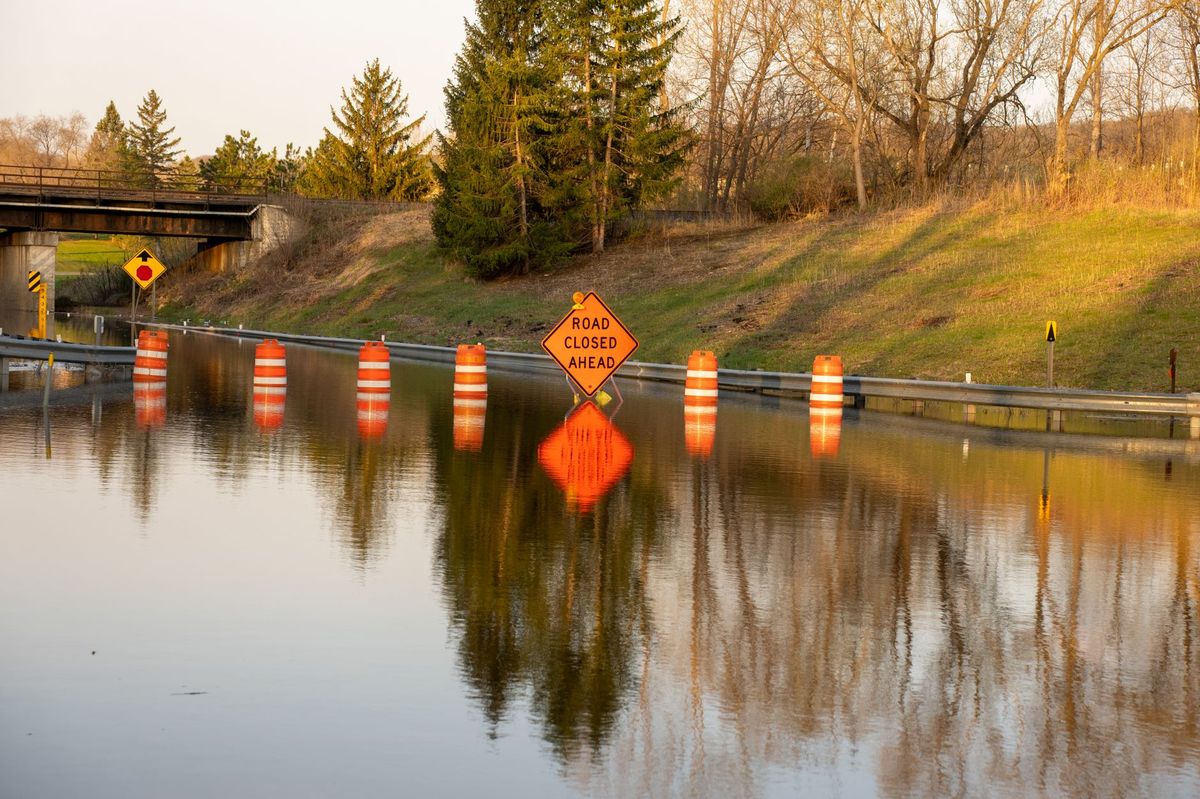
Multi-Use Trail Construction: $1.8 billion. Multi-use trails (shared-use paths for bicycles, pedestrians, and other non-motorized users) represent the largest single category of bike infrastructure spending. Trail construction involves clearing and grading a trail corridor typically 10 to 14 feet wide, installing a paved surface (asphalt or concrete) on a prepared subbase, constructing bridges and boardwalks for water crossings and wetland areas, installing drainage systems, retaining walls, and erosion control, and adding amenities including lighting, signage, rest areas, and trailhead facilities.
Trail construction costs vary significantly by terrain and setting. Urban rail-trail conversions on abandoned rail corridors average $1.5 to $3 million per mile due to existing graded right-of-way. Suburban greenway trails through parkland average $800,000 to $2 million per mile. Mountain or riparian trails requiring significant earthwork, retaining walls, and bridge structures can cost $3 to $8 million per mile. The most expensive trail projects — those requiring tunnels, major bridge structures, or construction through environmentally sensitive areas — can exceed $15 million per mile.
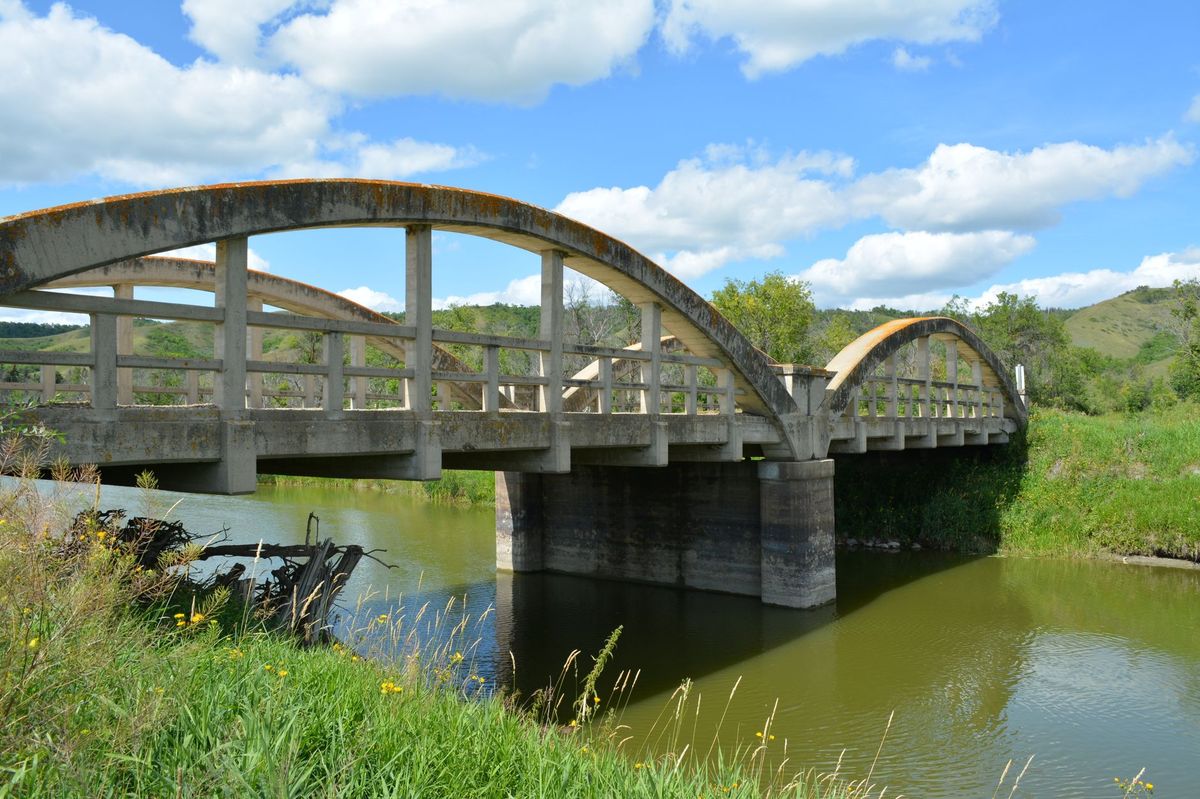
Bicycle Bridge and Overpass Construction: $420 million. Dedicated bicycle and pedestrian bridges are the highest-cost-per-unit category of bike infrastructure. These structures range from simple prefabricated steel truss spans over streams ($200,000 to $500,000) to architecturally significant signature bridges over highways and rivers ($5 million to $50+ million). Active projects include the 11th Street Bridge Park in Washington, DC ($120 million for a public park on a bridge structure over the Anacostia River), multiple highway overcrossing projects in California, Colorado, and Minnesota ($3 to $15 million each), and river crossing bridges in Portland, Minneapolis, and Austin ($8 to $25 million each).
Intersection Reconstruction: $240 million. Making intersections safer for cyclists often requires complete reconstruction including raised intersections that bring the roadway up to sidewalk level, protected intersection designs with corner refuge islands and setback crossings, signal systems with dedicated bicycle detection and signal phases, and curb extensions and turning radius modifications. Protected intersection reconstructions cost $500,000 to $2 million per intersection depending on size and complexity.
Bike Parking and Support Facilities: $140 million. Secure bicycle parking garages, bikeshare station construction, and maintenance facility construction round out the spending categories. A full-scale secure bike parking facility (200 to 500 spaces) costs $3 to $8 million.
Federal Funding Sources
The IIJA significantly increased federal funding available for bike infrastructure through several programs. The Transportation Alternatives Program (TAP) received $7.2 billion over five years for pedestrian and bicycle projects, safe routes to school, and recreational trails. The PROTECT program provides formula and competitive grants for resilient transportation infrastructure, including multi-use trails and protected facilities. The Reconnecting Communities program ($3.4 billion) funds removal of transportation barriers, often including construction of bike and pedestrian connections across or through highway corridors. The Active Transportation Infrastructure Investment Program ($45 million pilot in IIJA, with authorization for expansion) directly funds bicycle networks.
State and local matching funds typically leverage federal dollars 3:1 to 5:1, meaning federal investments generate total construction spending several times the federal contribution alone.
Construction Workforce and Contractors
Bike infrastructure construction employs a diverse range of contractors and trades. Protected bike lane and intersection projects are typically constructed by roadway contractors with paving, concrete, and traffic signal capabilities — the same firms that handle routine road reconstruction. Multi-use trail construction attracts both roadway contractors and specialized trail builders with experience in environmentally sensitive construction, boardwalk and bridge construction, and natural surface trail techniques.
The workforce requirements include heavy equipment operators for grading and paving, concrete workers for curbs, barriers, and bridge structures, electricians for signal and lighting installation, ironworkers for bridge and overpass construction, and landscape and restoration specialists for environmental mitigation. Active bike infrastructure projects employ an estimated 12,000 to 15,000 construction workers nationally.
Market Outlook
Bike infrastructure construction spending is projected to grow to $5 billion annually by 2028, driven by continued IIJA funding disbursement, city-level commitments to complete bike networks (New York, Chicago, Denver, Portland, and Austin each have planned bike network investments exceeding $100 million), growing demand for last-mile connections to transit, and electric bike adoption increasing the effective range and appeal of cycling infrastructure.
For construction firms, the bike infrastructure market offers several advantages: projects are typically smaller in scale ($500,000 to $10 million) and faster to complete than highway or transit projects, reducing bonding and working capital requirements. The work is distributed across hundreds of cities and towns, providing geographic diversification. And the technical requirements — grading, paving, concrete work, signal installation, bridge construction — align well with existing capabilities of small to mid-size roadway and civil contractors.
The political dynamics are also favorable for sustained spending. Bike infrastructure enjoys bipartisan support at the local level (even in cities where state politics may be more contentious), and the projects are highly visible, making them attractive to elected officials seeking tangible improvements in their communities. The numbers tell a different story than the national political discourse suggests: at the local level, bike infrastructure construction is growing steadily across cities of all sizes and political orientations.
The E-Bike Factor
Electric bicycle adoption is fundamentally changing the design requirements and construction specifications for bike infrastructure. E-bikes now represent approximately 35% of adult bicycle sales in the United States, and their higher operating speeds (typically 15 to 28 mph, compared to 10 to 15 mph for conventional bicycles) create new design considerations for infrastructure construction.
Key construction implications of e-bike adoption include wider facilities (12 to 14 feet rather than 10 feet for two-directional multi-use trails) to accommodate speed differentials between conventional and electric bicycles, improved surface quality requirements (smoother pavement, fewer joints, better drainage) because e-bikes at higher speeds are more sensitive to surface imperfections, enhanced sight distance at curves and intersections (requiring more generous horizontal and vertical alignment), wider protective barriers (concrete barriers rather than flexible bollards) for protected bike lanes carrying high-speed e-bike traffic, and charging infrastructure at bike parking facilities.
These upgraded design standards increase construction costs per mile by approximately 15 to 25% compared to conventional bike infrastructure, but they also increase the utility and user base of the facilities — which helps justify the investment.
Economic Impact and Property Values
Research from the National Association of Realtors and multiple academic studies documents the property value impacts of bike infrastructure construction. Properties within a quarter-mile of high-quality bike infrastructure (protected lanes, multi-use trails) show property value premiums of 3 to 11% compared to similar properties without bike access. Multi-use trails show the strongest effect, with nearby property values increasing by an average of $4,600 to $12,500 per home.
These property value effects generate additional tax revenue that can partially offset bike infrastructure construction costs. A 10-mile multi-use trail costing $20 million might generate $50 to $100 million in property value increases for nearby homes — producing $500,000 to $1 million in additional annual property tax revenue at typical effective tax rates.
For construction firms and their municipal clients, these economic impact data provide important support for bike infrastructure investment decisions and help secure funding from elected officials who must justify construction spending to constituents.
Trail Network Construction: The Regional Approach
Multi-jurisdictional trail networks that connect communities across county and state boundaries represent the fastest-growing and highest-value segment of bike infrastructure construction. These regional networks transform trails from recreational amenities into transportation infrastructure, justifying larger construction investments and generating broader economic benefits.
The Great American Rail-Trail — a planned 3,700-mile cross-country trail from Washington, DC to Washington State — has approximately 53% of the route completed as of 2026, with active construction on over 200 miles of trail segments. Total construction investment in the trail network exceeds $500 million in active projects across 12 states. Individual trail segments range from $800,000 per mile for rail-trail conversions to $5 million per mile for segments requiring bridge construction, tunnel rehabilitation, or construction through environmentally sensitive areas.
The East Coast Greenway — a 3,000-mile trail network connecting Maine to Florida — has approximately 35% of its route on dedicated trail infrastructure, with active construction on over 150 miles of new trail segments. Major construction projects on the East Coast Greenway include trail bridges, underpasses, and grade-separated crossings that allow uninterrupted trail travel across major roads and highways.
Regional trail construction creates particular opportunities for bridge contractors. Trail bridges range from simple prefabricated steel truss spans over creeks ($200,000 to $500,000) to architecturally significant signature crossings over rivers and highways ($5 million to $50 million). The engineering requirements for trail bridges differ from highway bridges — lighter load requirements (100 PSF pedestrian loading vs. HL-93 highway loading) but often longer spans, distinctive architectural designs, and integration with natural landscapes.
Maintenance Facility Construction
As bike networks expand, cities are constructing dedicated maintenance and operations facilities to support network upkeep. These facilities include secure employee work areas with tool storage and vehicle maintenance bays, materials storage for pavement repair supplies, signage, and landscaping materials, equipment storage for sweepers, snow plows (for winter maintenance in northern cities), and vegetation management equipment, and administrative offices for network management staff.
Bike network maintenance facilities typically cost $2 to $8 million to construct, depending on size and scope. Larger cities with extensive bike networks — New York, Chicago, Portland — are constructing multiple distributed maintenance facilities to support geographically efficient maintenance operations. These facilities use standard light industrial construction methods (pre-engineered metal buildings, concrete slab-on-grade, basic MEP systems) that are well within the capabilities of general commercial contractors.
Funding Mechanisms and Bond Measures
Local bond measures have become the primary funding mechanism for large-scale bike infrastructure construction programs. Recent successful bond measures include Austin's 2020 Project Connect ($7.1 billion, with $480 million for active transportation), Denver's 2022 Transportation Bond ($480 million, with $140 million for bike infrastructure), Portland's 2020 Transportation Bond ($390 million, with $120 million for bike and pedestrian projects), and San Francisco's 2024 Transportation Bond ($580 million, with $200 million for protected bike lanes and trail construction).
These bond-funded programs create multi-year construction pipelines that provide predictable demand for bike infrastructure contractors. A typical bond-funded bike program rolls out over 8 to 12 years, with annual construction spending of $15 to $50 million — sufficient to sustain dedicated bike infrastructure construction crews and justify investment in specialized equipment.
Federal funding complements local bond measures. The IIJA's Transportation Alternatives Program provides $1.4 billion per year nationally for pedestrian and bicycle projects. States must suballocate 59% of TAP funds to metropolitan planning organizations based on population, ensuring geographic distribution of funding. Individual TAP grants typically range from $200,000 to $5 million, funding protected bike lane segments, trail construction, and intersection improvements.
Related Reading
Frequently Asked Questions
How much federal funding goes to bike infrastructure construction?
According to the latest industry data, bike infrastructure construction is showing notable trends in 2026. Current figures indicate $3.8 billion, which represents a significant benchmark for contractors and developers planning projects this year. Regional variations apply, so checking local market conditions remains essential for accurate budgeting.
Which states benefit most from bike infrastructure construction?
Market research on bike infrastructure construction shows that geographic concentration matters significantly. With figures reaching $1.2 billion in key markets, the opportunities are substantial but location-dependent. States with strong population growth and infrastructure investment tend to see the highest activity levels.
What is the timeline for bike infrastructure construction projects?
The trajectory for bike infrastructure construction tells an important story when viewed against historical benchmarks. With the latest data showing $40, the trend has clear implications for project feasibility, bidding accuracy, and resource allocation across the construction sector.