March Housing Starts: The Headline Numbers
The Census Bureau and HUD released their joint New Residential Construction report on April 2, and the topline is straightforward: housing starts hit a seasonally adjusted annual rate of 1.42 million units in March 2026, up 3.2% from February's revised figure of 1.376 million.
That puts March among the stronger months in the past year, though still well below the 1.55-1.60 million range economists consider necessary to close the national housing deficit. The three-month moving average sits at 1.39 million, trending upward but not dramatically so.
For residential contractors, the picture is more nuanced than the headline suggests. The gains were concentrated in single-family, the permit data pointed in the opposite direction of starts, and regional disparities continue to widen.
Single-Family Drove the Gain
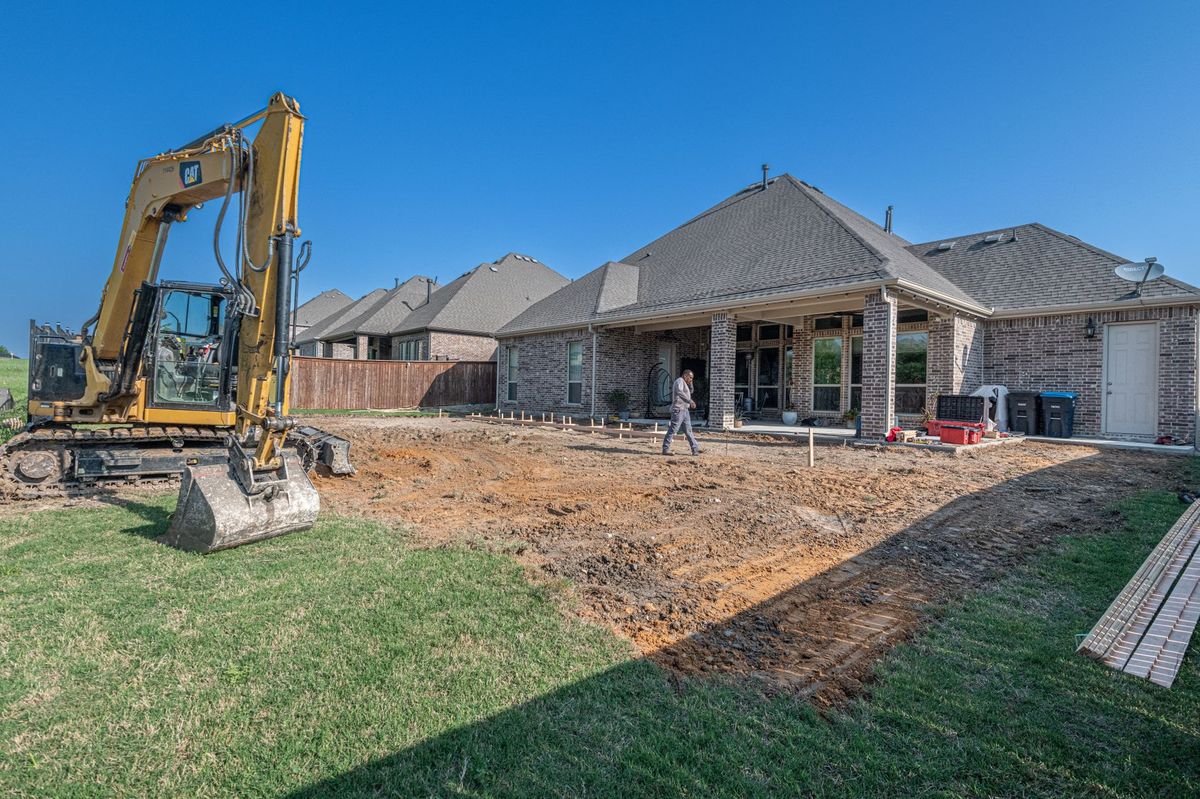
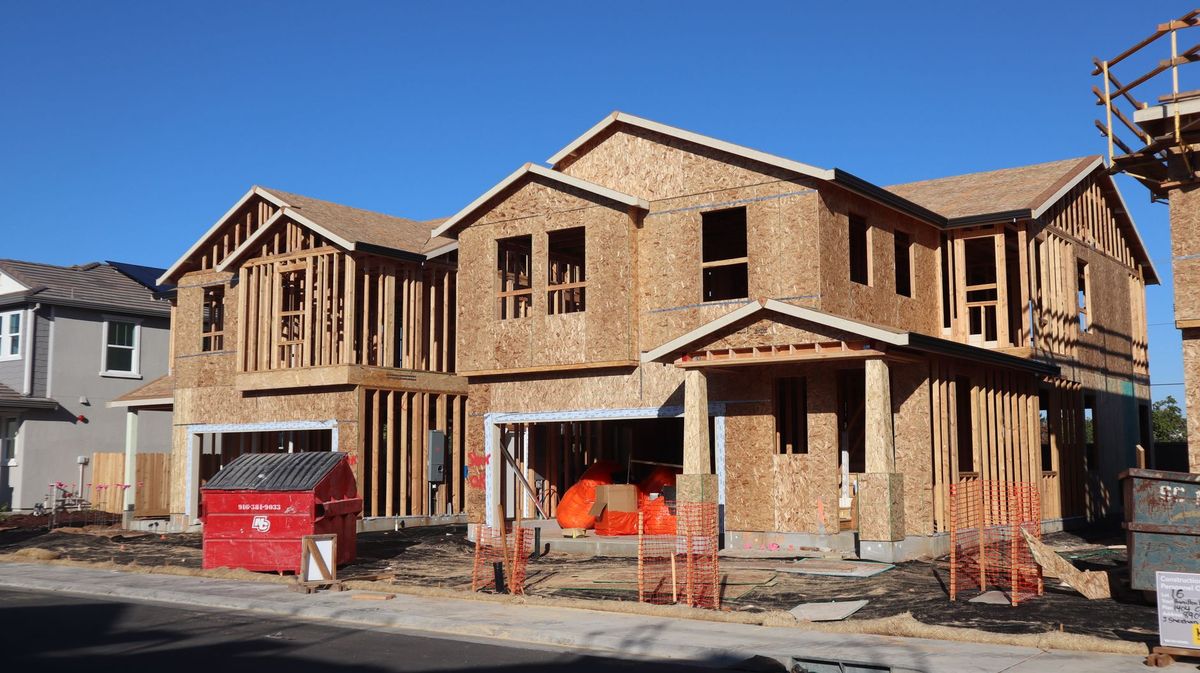
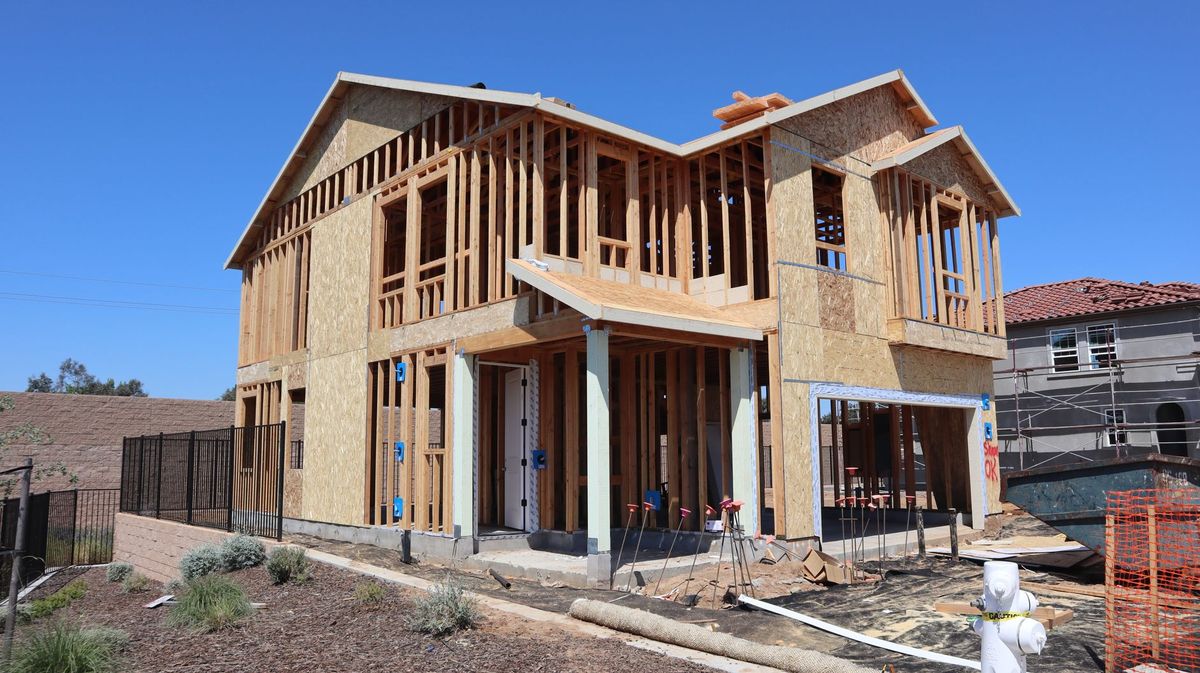
Single-family starts came in at 1.04 million SAAR, up 4.1% from February and 7.8% from March 2025. That is the highest single-family reading since November 2025 and reflects continued demand from homebuyers who have largely accepted the current rate environment.
Multifamily starts, by contrast, came in at 380,000 SAAR — essentially flat month-over-month and down 9.2% year-over-year. The apartment pipeline is still digesting the massive wave of units that broke ground in 2022 and 2023. According to RealPage, approximately 670,000 apartment units are still under construction nationally, and vacancy rates in several Sun Belt markets have climbed past 8%. Developers are cautious about adding more supply until absorption catches up.
For contractors focused on multifamily, the slowdown is real but not uniform. Markets with strong employment growth and limited existing inventory — think Nashville, Raleigh, and Boise — are still seeing new project launches. But the broad-based apartment construction surge of two years ago is not coming back in 2026.
Building Permits Tell a Different Story
Here is where contractors should pay closer attention. Building permits declined 1.1% in March to a seasonally adjusted annual rate of 1.46 million. Single-family permits slipped 0.8% to 985,000, and multifamily permits fell 1.9% to 475,000.
Permits are a leading indicator. They represent work that will break ground in the coming one to six months, depending on the project type and jurisdiction. A modest decline in a single month is not cause for alarm — permit data is volatile and subject to revision. But the trend matters. Permits have been essentially flat since December, and the March dip marks the first time in four months that both single-family and multifamily permits moved down simultaneously.
The National Association of Home Builders reported that its Housing Market Index stood at 44 in March, still below the neutral threshold of 50. That reading reflects builder sentiment rather than actual activity, but it aligns with the permit data: builders are not pulling back hard, but they are not accelerating either.
Regional Breakdown: The South Dominates
The regional data continues to tell a familiar story. The South accounted for 54% of all housing starts in March, consistent with its multi-year trend as the center of gravity for U.S. homebuilding. Texas, Florida, Georgia, the Carolinas, and Tennessee remain the volume leaders.
Census Bureau regional figures for March:
- South: 767,000 SAAR (54% of total), up 2.8% month-over-month
- West: 327,000 SAAR (23% of total), up 5.9% month-over-month
- Midwest: 195,000 SAAR (14% of total), up 1.6% month-over-month
- Northeast: 131,000 SAAR (9% of total), down 0.8% month-over-month
The West's 5.9% monthly gain stands out. That region has been the weakest performer for much of the past 18 months, hurt by high land costs, restrictive zoning in coastal metros, and insurance availability issues in fire-prone areas. The March uptick was driven primarily by activity in Phoenix, Las Vegas, and the Inland Empire — markets where land is more available and permitting timelines are shorter than in coastal California.
The Northeast remains constrained by the same factors that have limited its share for years: high labor costs, lengthy entitlement processes, and limited greenfield land. Connecticut, New Jersey, and Massachusetts have all seen starts decline year-over-year despite strong underlying demand.
Mortgage Rates and Affordability Pressure
Freddie Mac's Primary Mortgage Market Survey put the average 30-year fixed rate at 6.82% for the week ending March 27. That is down from the 7.1% peak reached in October 2025 but well above the sub-3% rates that fueled the 2020-2021 housing frenzy.
The affordability math is challenging. The National Association of Realtors reports that the monthly payment on a median-priced existing home ($398,400 in February) with 20% down at current rates is approximately $2,090 — roughly 27% of median household income. That ratio has improved slightly from its 2024 peak but remains elevated by historical standards.
For residential contractors, affordability pressure manifests in several ways. Spec home builders report longer sales cycles and more price concessions, particularly for homes above $500,000. Custom builders say clients are value-engineering projects more aggressively, cutting square footage or deferring finish upgrades. And the entry-level segment — homes under $300,000 — remains severely undersupplied because the math on building affordable new construction is extremely difficult at current land and labor costs.
The NAHB estimates that regulatory costs (permits, impact fees, code compliance, and other government-imposed costs) now account for 24.3% of the final price of a new single-family home. That figure was 18.2% in 2011.
Lot Availability Constraints
Land remains one of the biggest bottlenecks for residential construction. The NAHB reports that 62% of builders cite lot availability as a significant problem, up from 55% two years ago. Finished lot inventory — lots that are graded, have utilities stubbed in, and are ready for vertical construction — is particularly tight in high-growth metros.
The lot development pipeline has its own lead time. Converting raw land to finished lots takes 18 to 36 months in most markets, longer in jurisdictions with complex environmental review requirements. Several large national builders have secured land positions years out, but smaller and mid-size builders often compete for the remaining inventory at prices that compress margins.
In practical terms, this means contractors in high-growth markets are increasingly building in exurban locations — further from employment centers, requiring longer commutes, but where land is available. It also means more infill and teardown projects in established neighborhoods, which tend to be smaller, more complex, and carry higher per-unit costs.
Labor Market Tightness in Residential Trades
The Bureau of Labor Statistics reported 413,000 job openings in construction as of the most recent JOLTS data. The residential sector feels this acutely. Framers, roofers, siding installers, and finish carpenters are in short supply in nearly every metro area with active homebuilding.
The Associated Builders and Contractors estimates that the construction industry needs to attract roughly 501,000 additional workers in 2026 to meet demand. Residential trades are among the hardest to fill because the work is physically demanding, often outdoors, and competes with commercial and industrial construction that frequently offers higher wages and more consistent schedules.
Wage growth in residential trades has been running at 3.5% to 5.0% annually, which is helping attract workers but also raising the cost basis for every home built. Subcontractor pricing has followed suit. Several production builders have reported that their trade base costs increased 6% to 8% over the past year, outpacing general material inflation.
Cycle times — the number of days from permit to certificate of occupancy — have stabilized after the disruptions of 2021-2023 but remain elevated. The NAHB reports an average single-family cycle time of 8.3 months, compared to a pre-pandemic norm of around 7 months. Scheduling trades remains one of the biggest operational challenges for builders of all sizes.
What This Means for Residential Contractors
The March starts data paints a picture of a housing market that is functional but not booming. Single-family activity is solid, driven by persistent demand and a deficit of existing homes for sale. Multifamily is in a correction phase that may last through most of 2026. Permits suggest the near-term pipeline is holding steady rather than growing.
For contractors, several practical takeaways emerge from this data:
Pipeline Management
The gap between starts (up) and permits (down) means the current workload is healthy but the six-month outlook requires monitoring. Contractors who rely heavily on one or two builders should watch those builders' permit activity closely.
Pricing Discipline
With material costs still elevated and labor tight, the temptation to chase volume at thin margins is a risk. The builders who weathered previous cycles best were those who maintained pricing discipline even when competitors undercut them.
Geographic Positioning
The South and West are where the volume is. Contractors in the Northeast and Midwest face structurally lower demand and should plan accordingly — either by diversifying into remodeling and light commercial or by serving the niche segments (luxury, custom, age-restricted) that are less sensitive to rate pressures.
Workforce Development
Apprenticeship enrollment in residential trades is up 8% nationally per the Department of Labor, but that growth is not keeping pace with retirements. Contractors who invest in training and retention now will have a meaningful competitive advantage as the current workforce ages out.
The next major data point will be the April housing starts report, due May 16. In the interim, watch mortgage rate trends, the NAHB builder confidence survey, and the Census Bureau's monthly construction spending data for signals on where the market is heading.
Data sources: U.S. Census Bureau / HUD New Residential Construction report (April 2, 2026), Freddie Mac Primary Mortgage Market Survey, NAHB/Wells Fargo Housing Market Index, Bureau of Labor Statistics JOLTS, National Association of Realtors, RealPage, Associated Builders and Contractors.
Frequently Asked Questions
How much does housing starts march 2026 cost in 2026?
Federal and state data confirm that housing starts march 2026 continues to be a major factor in 2026 construction planning. The latest available figure of 3.2% provides a useful baseline, though actual costs vary by region, project scope, and market conditions. Contractors should request updated quotes from suppliers and subcontractors before finalizing bids.
What states have the most housing starts march 2026 activity?
Regional analysis of housing starts march 2026 reveals uneven distribution across U.S. markets. The data point of 4.1% highlights the scale of activity, with Sun Belt and high-growth metro areas generally leading in volume. Contractors expanding into new territories should evaluate local demand indicators before committing resources.
How does housing starts march 2026 compare to last year?
The trajectory for housing starts march 2026 tells an important story when viewed against historical benchmarks. With the latest data showing 7.8%, the trend has clear implications for project feasibility, bidding accuracy, and resource allocation across the construction sector.