The Federal Highway Administration's National Bridge Inventory database contains records for 621,000 highway bridges in the United States. Of those, 42,966 are classified as structurally deficient as of the January 2026 data update — meaning their deck, superstructure, or substructure has been rated in poor condition during the most recent inspection.
That number represents 6.9% of the nation's bridge inventory. The repair, rehabilitation, or replacement of these structures carries an estimated price tag of $319 billion, according to the American Society of Civil Engineers' 2025 Infrastructure Report Card.
The numbers tell a different story than the political rhetoric on either side. Progress is being made — the structurally deficient count has dropped from 56,007 in 2016. But the pace of improvement cannot keep up with the rate of deterioration across the aging inventory.
Understanding Structural Deficiency: What the Rating Means
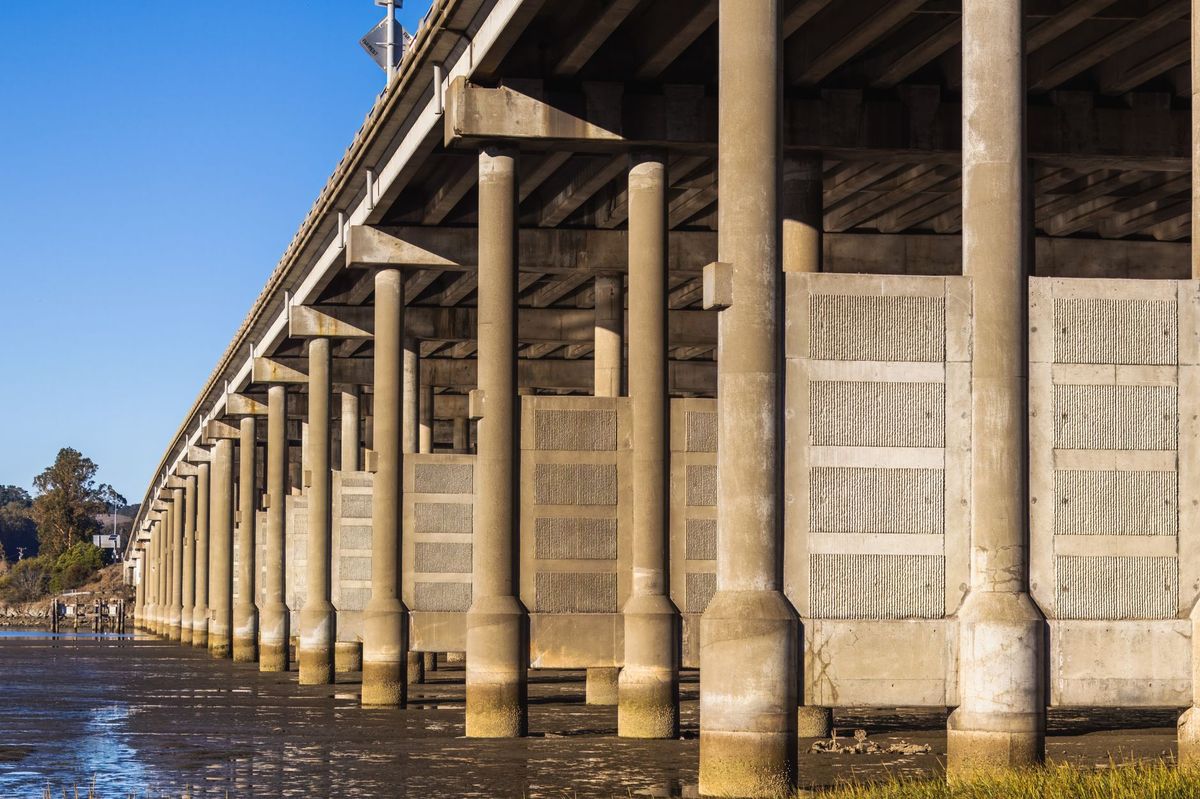
A structurally deficient classification does not mean a bridge is unsafe or at imminent risk of collapse. According to FHWA standards, it means that one or more of the bridge's three primary components — the deck (driving surface), the superstructure (beams and girders), or the substructure (piers and abutments) — received a condition rating of 4 or below on a 0-to-9 scale during its most recent inspection.
A rating of 4 corresponds to "poor" condition, indicating advanced deterioration, section loss, cracking, or scour that significantly reduces the load-carrying capacity of the element. Bridges rated 3 ("serious") or below typically receive weight restrictions or emergency repairs.
Federal regulations require that all highway bridges be inspected at least once every 24 months, with some states mandating annual inspections. Structurally deficient bridges require inspection intervals of 12 months or less, according to 23 CFR 650.311.
The inspection regime works. According to FHWA data, the number of bridge collapses on the National Highway System has averaged fewer than 3 per year over the past decade, despite the large number of deficient structures. Weight postings, traffic restrictions, and emergency repairs keep deficient bridges functional until permanent repairs or replacement can be funded.
State Rankings: Where the Problem Is Worst
The distribution of structurally deficient bridges varies enormously by state. According to the January 2026 NBI data:
Iowa leads the nation with 4,571 structurally deficient bridges, representing 19.3% of its 23,710 bridge inventory. Iowa's high count reflects its enormous rural bridge inventory — the state has more bridges per capita than any other, a legacy of its dense grid road system crossing thousands of waterways.
Pennsylvania ranks second with 3,614 structurally deficient bridges (14.4% of inventory), followed by Oklahoma with 2,874 (13.1%), Illinois with 2,502 (10.3%), and Missouri with 2,348 (9.6%).
By percentage of inventory, the rankings shift. West Virginia has the highest deficiency rate at 21.4%, followed by Iowa (19.3%), Rhode Island (18.7%), South Dakota (17.2%), and Louisiana (16.8%).
States with the lowest deficiency rates include Nevada at 1.4%, Arizona at 1.8%, Texas at 2.1%, Florida at 2.3%, and Utah at 2.5%. These states benefit from newer bridge inventories (many were built during post-war expansion), drier climates that reduce corrosion, and sustained state bridge investment programs.
The Age Problem: Average Bridge Age Is 44 Years
The fundamental driver of bridge deterioration is age. According to FHWA data, the average age of a US highway bridge is 44 years. The typical design life for a concrete bridge is 50 to 75 years, while steel bridges are designed for 50 years with proper maintenance.
The age distribution reveals the challenge. Approximately 130,000 bridges (21% of the inventory) were built before 1960 and are now over 65 years old. Another 195,000 bridges (31%) were built during the Interstate Highway System construction boom between 1960 and 1979, meaning they are now 47 to 66 years old and approaching or exceeding their original design life.
The Interstate era bridges present the most urgent challenge. These structures carry the highest traffic volumes — the Interstate system handles 25% of all vehicle miles traveled in the US, according to FHWA — and were designed for traffic loads and vehicle weights far below current levels. A bridge designed in 1965 for the standard HS-20 loading may now carry truck loads 30 to 50% heavier than its design capacity.
The $319 Billion Gap: IIJA Funding vs. Actual Need
The IIJA authorized $40 billion specifically for bridge repair and replacement — the largest dedicated federal bridge investment in decades. But that figure represents just 12.5% of the $319 billion total estimated need, according to ASCE.
The $319 billion estimate includes:
- $187 billion for rehabilitation and replacement of the 42,966 structurally deficient bridges
- $78 billion for preventive maintenance on bridges currently in fair condition to prevent them from becoming deficient
- $54 billion for seismic retrofitting, scour countermeasures, and climate adaptation improvements on bridges in vulnerable locations
According to the FHWA, the average cost to replace a structurally deficient bridge is $4.35 million, though costs vary dramatically by size and location. Rural county bridges may cost $500,000 to $2 million to replace, while major Interstate bridges can cost hundreds of millions or even billions.
The IIJA's $40 billion bridge authorization is being tracked and disbursed through multiple programs, with $27 billion reaching states through Q1 2026. The Bridge Formula Program distributes formula funds based on each state's share of deficient bridges, while the competitive Bridge Investment Program targets the largest and most complex projects.
At the current rate of replacement — approximately 1,800 bridges per year receiving major rehabilitation or replacement, according to FHWA data — it would take 24 years to address only the bridges currently classified as structurally deficient. Meanwhile, bridges currently in fair condition continue to deteriorate into deficiency.
Cost Per Bridge: Understanding the Economics
Bridge repair and replacement costs are driven by five primary factors, according to the National Cooperative Highway Research Program:
Bridge length and width are the most significant cost drivers. FHWA data shows that the average structurally deficient bridge spans 115 feet with a 28-foot deck width. Bridges over 500 feet in length represent just 4% of the deficient inventory but account for 31% of the total repair cost.
Traffic management during construction adds 15 to 30% to project costs on high-volume routes. Maintaining traffic flow on an Interstate bridge replacement requires temporary widening, phased construction, and often nighttime-only work restrictions that reduce productivity.
Environmental and regulatory compliance adds another 10 to 20%. Bridges over waterways require Clean Water Act Section 404 permits, endangered species consultations, and often fish passage improvements. The permitting timeline for a bridge replacement over a navigable waterway averages 3.2 years, according to AASHTO.
Material costs have increased significantly. According to the Bureau of Labor Statistics Producer Price Index, structural steel prices rose 14% between January 2025 and January 2026, while ready-mix concrete prices increased 9%. Prestressed concrete girders — used in approximately 60% of new bridge construction — saw lead times extend to 16 to 24 weeks.
Labor costs for bridge construction are among the highest in the industry. According to BLS data, heavy and highway construction workers earned a mean hourly wage of $32.40 in 2025, with ironworkers (critical for bridge construction) earning $37.80 and pile driver operators earning $40.20.
Innovative Delivery Methods Accelerating Repairs
States are adopting accelerated bridge construction (ABC) techniques to reduce construction timelines and costs. According to FHWA, 248 ABC projects were completed in 2025, up from 180 in 2023.
Prefabricated bridge elements and systems (PBES) allow bridge components to be manufactured off-site and assembled rapidly. The Utah DOT completed a full Interstate bridge replacement in just 72 hours using prefabricated deck panels and precast abutment walls, versus the 12 to 18 months a conventional replacement would have required.
Slide-in bridge construction — where a new bridge is built on temporary supports adjacent to the existing bridge, then slid into place during a short road closure — has been used on 43 projects since 2022, according to FHWA's ABC database.
These methods typically cost 10 to 15% more than conventional construction but reduce road closure durations by 60 to 80%, resulting in significant user delay cost savings. FHWA estimates that user delay costs for Interstate bridge closures average $250,000 per day in direct economic impact.
Climate Change and Extreme Weather Threats
Climate change is accelerating bridge deterioration. According to a 2025 study published by the Transportation Research Board, 14,000 US bridges are in locations projected to experience increased flood risk by 2050 due to changing precipitation patterns.
Scour — the erosion of bridge foundation material by flowing water — is the leading cause of bridge failure in the United States, responsible for 60% of all bridge collapses, according to FHWA. Increasing storm intensity and frequency directly increases scour risk.
Temperature extremes also affect bridge performance. Bridges with steel expansion joints and bearings designed for historical temperature ranges are experiencing premature joint failures as temperature swings widen. The Texas DOT reported 23% more expansion joint repairs in 2025 compared to the 2015-2019 average, attributed to more extreme heat events.
FHWA has begun requiring climate resilience assessments for all IIJA-funded bridge projects. The requirement adds engineering analysis but helps ensure that replacement bridges are designed for projected conditions rather than historical data.
The Workforce Bottleneck
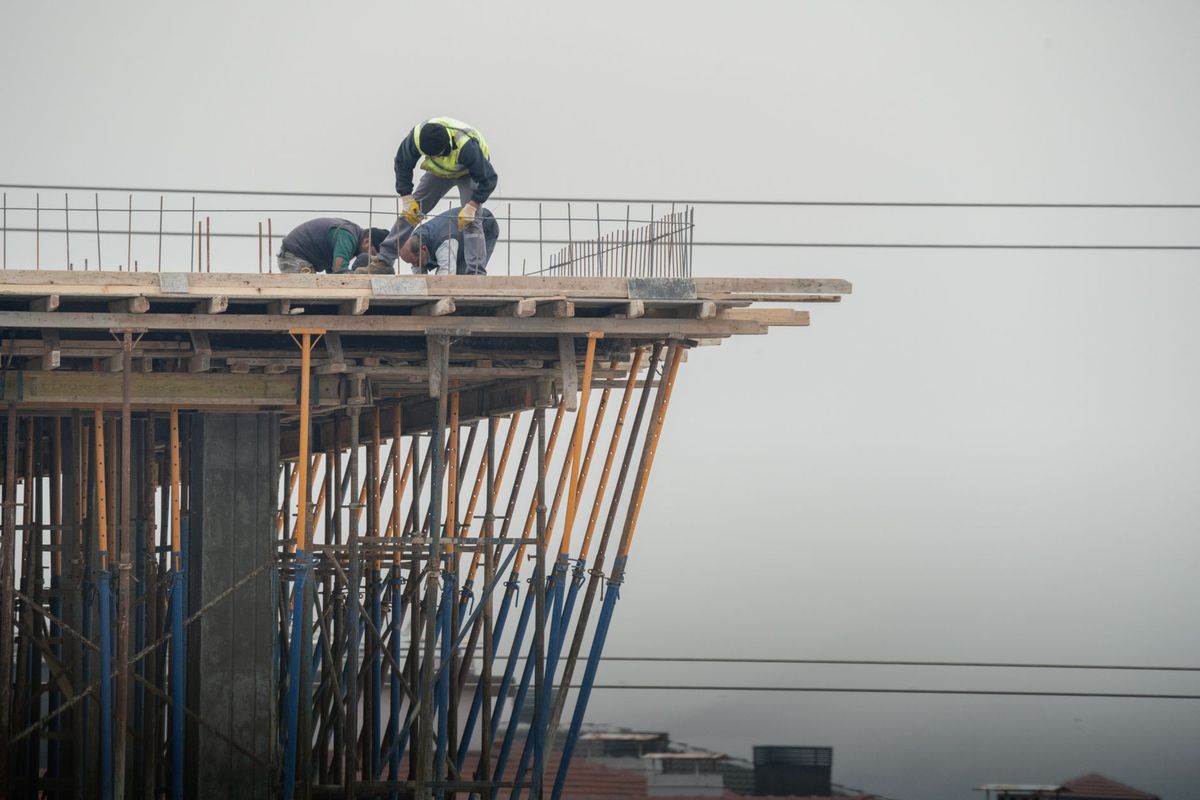
Bridge construction requires specialized skills that are in particularly short supply. According to the Associated General Contractors of America, 82% of bridge contractors reported difficulty finding qualified workers in 2025 — the highest of any construction subsector.
Key shortage trades include certified welders for structural steel connections (requiring AWS D1.5 Bridge Welding Code certification), pile drivers, and post-tensioning technicians. The National Center for Construction Education and Research (NCCER) reports that certified bridge welders earn $42 to $58 per hour but that the number of new certifications has declined 18% since 2019.
States are responding with training investments. PennDOT launched a $12 million bridge construction apprenticeship program in 2025. Iowa's DOT partnered with community colleges to create a bridge inspection technician certificate program that has graduated 340 inspectors since 2023.
State Funding: The Other Side of the Equation
Federal IIJA funds cover only a portion of bridge needs. State DOTs have increased their own bridge budgets significantly, but many states still face funding gaps.
According to the American Association of State Highway and Transportation Officials (AASHTO), state-funded bridge investment reached $18.7 billion in fiscal year 2025, up from $14.2 billion in 2020. Combined with federal IIJA funds, total public bridge investment reached approximately $27 billion in 2025 — substantial but still well below the $40 billion per year the ASCE estimates is needed to eliminate the backlog within 20 years.
Twelve states have enacted new bridge-specific funding mechanisms since 2021. Missouri's $2.8 billion Bridge Program, funded by bonds backed by fuel tax revenue, is rehabilitating 250 bridges per year. Pennsylvania's $1.4 billion P3 Rapid Bridge Replacement Program has completed 558 bridge replacements since its inception.
What Contractors Should Do Now
The bridge repair backlog represents a multi-decade construction opportunity with stable federal and state funding. Contractors seeking to enter or expand in bridge work should pursue two immediate actions. First, invest in ABC and PBES capabilities — states are increasingly requiring accelerated methods for Interstate bridge projects, and contractors with demonstrated ABC experience win disproportionate bid awards. Second, ensure your welding workforce holds AWS D1.5 Bridge Welding Code certification; this single credential is the most common barrier to bridge project prequalification, and investing in welder certification now positions your firm for the $27 billion annual bridge market.
Frequently Asked Questions
How many structurally deficient bridges are there in the US?
The FHWA National Bridge Inventory lists 42,966 structurally deficient bridges as of January 2026, representing 6.9% of the 621,000 highway bridges in the United States. Iowa has the most deficient bridges at 4,571, while West Virginia has the highest deficiency rate at 21.4%.
How much does it cost to repair a structurally deficient bridge?
The FHWA estimates the average cost to replace a structurally deficient bridge is $4.35 million, though costs range from $500,000 for rural county bridges to hundreds of millions for major Interstate structures. The total repair backlog for all deficient bridges is estimated at $319 billion by the American Society of Civil Engineers.
Is IIJA bridge funding enough to fix the problem?
The IIJA authorized $40 billion for bridge repair and replacement, but this covers only 12.5% of the estimated $319 billion need. Combined with state funding of $18.7 billion per year, total bridge investment is approximately $27 billion annually — still below the $40 billion per year ASCE estimates is needed to eliminate the backlog within 20 years.