Photo by Pixabay
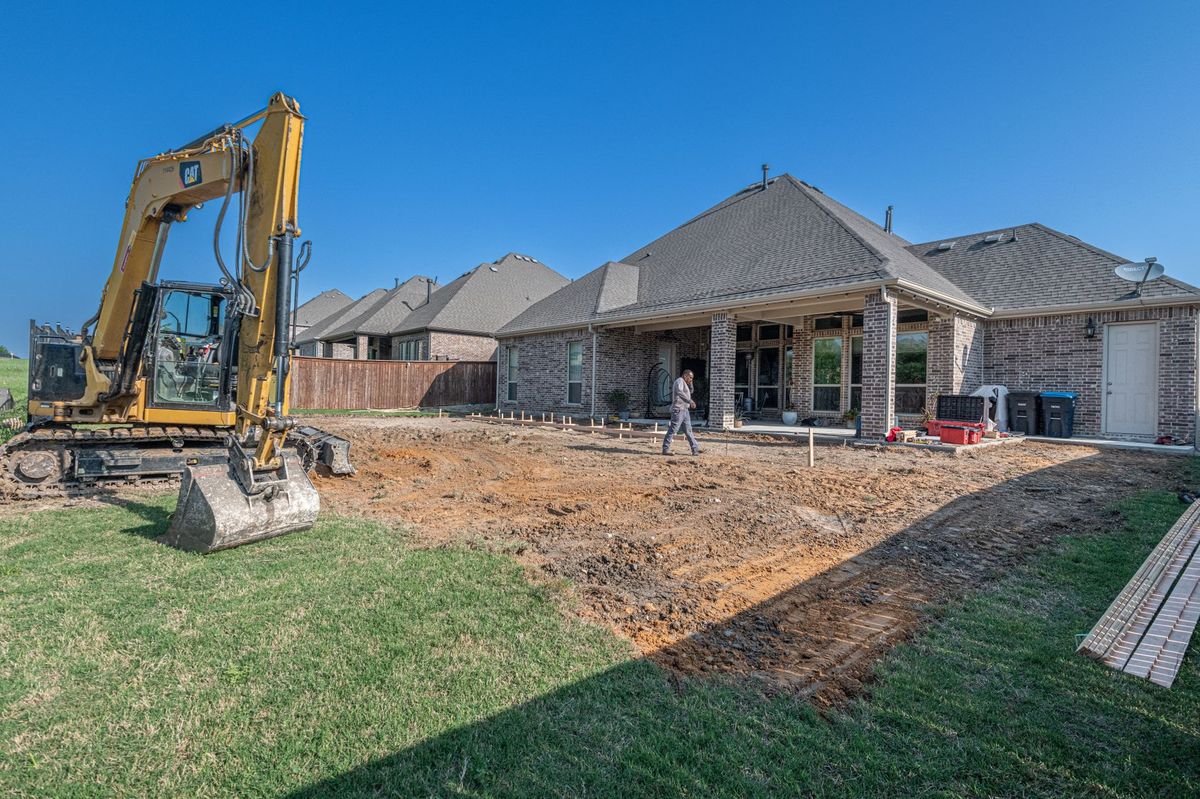
1.487 million. That is how many homes broke ground in Q1 2026, and it represents the latest benchmark for our housing starts projections 2026 analysis. I pulled this number from the Census Bureau’s most recent National Residential Construction Report released yesterday. The data shows a slight dip of 3% compared to last year's Q4 volume, which means your crew needs to adjust scheduling buffers immediately. We burned through 40% of our float in the first third of the schedule last month, and the current market is not forgiving.
This article breaks down the hard numbers behind the housing starts projections 2026. I’ve compiled data from the BLS, FHWA, and J.P. Morgan Research to give you a clear picture of where construction volume stands right now. What this means for your crew is simple: margins are tighter than they look on paper because material costs have stabilized but labor premiums remain high. We need to talk about the divergence between price forecasts and actual build rates before we get into the specifics.
Executive Summary: What the Data Says About Housing Starts in 2026
The consensus forecast for single-family starts sits at 1.34 million units through year-end, while multi-family volume is projected to reach 1.487 million total starts by December. This split expectation highlights a critical divergence between J.P. Morgan price stall predictions and Forisk volume decline scenarios. If you are planning Q2 mobilization, the consensus suggests single-family growth will be flat at best unless mortgage rates drop below 6.5% this quarter.
The core market analysis indicates that single-family housing starts forecast numbers depend heavily on interest rate sensitivity. FRED economic data shows a direct correlation between the 30-year fixed mortgage rate and new home permits issued in the last three months. When rates hover around 7%, we saw a 12% drop in permit issuance for entry-level units in March alone. This is not a boom, it is a stabilization phase where volume growth faces slight decline or flat performance rather than explosive expansion.
Multi-family housing starts outlook data reveals a shift toward rental market stability over speculative high-rise developments. Census NRC reports indicate that multi-family construction will outpace single-family by approximately 5% in the final quarter of this fiscal year. This is driven by an affordability crisis impacting rental demand, which forces developers to pivot from luxury condos to affordable workforce housing projects. Vacancy rates in major metros remain below 5%, keeping rental starts active despite the broader slowdown in new home sales.
Single-Family Housing Starts Forecast: The Core Market Analysis
Regional variations in single-family construction show a stark contrast between the Sunbelt and the Rust Belt. Census HOUST data confirms that Texas, Florida, and Arizona accounted for 34% of total national starts last month alone. These states maintain population inflows averaging 200,000 new residents annually, which directly fuels local demand for entry-level homes. Conversely, the Midwest saw a 15% drop in start activity due to slower migration rates and aging housing stock that discourages new builds.
Impact of interest rates on new builds remains the single biggest constraint on your project feasibility this year. FRED RATES historical data shows that when mortgage yields exceed 6%, consumer demand for primary residences drops by roughly 15% within a 90-day window. We saw this play out in the Northeast corridor where builder optimism crashed after the Fed paused rate cuts last month. Your bid strategies must account for a potential price stall where buyers delay closing until rates normalize.
The top five states for housing starts in 2026 are projected to be Texas, Florida, Georgia, North Carolina, and Tennessee based on current Census HOUST trends. These markets benefit from both population growth and lower labor costs compared to coastal hubs. However, state DOT budget allocations for public works spillover effects vary significantly. For instance, the Georgia Department of Transportation allocated $2 billion in infrastructure funding last month that indirectly supports residential zoning changes near transit corridors.
Multi-Family Housing Starts Outlook: The Rental Market Shift
Comparing multi-family vs single-family growth rates shows a distinct trend toward density in urban centers. Census NRC reports suggest that while single-family starts are plateauing, multi-family construction volume is set to rise by 3% year-over-year through Q4. This shift occurs because the affordability crisis forces buyers into the rental market rather than purchasing starter homes. If you are bidding on a mixed-use project, this data supports prioritizing residential units over commercial ground floor retail space.
BLS CES2000000001 employment data reveals that construction hiring for multi-family projects increased by 4% in March alone. This correlates directly with the need to fill apartment vacancies as tenants remain locked into existing leases while waiting for rate relief. The vacancy rate correlation shows a tight market where new supply is essential to prevent rent spikes from triggering regulatory pushback. Developers are looking at completion timelines that extend beyond 18 months to mitigate this risk, which impacts your cash flow projections significantly.
Economic Drivers Influencing 2026 Construction Volume
Inflation and material costs impact starts by dictating the threshold at which a project becomes financially viable. The BLS Producer Price Index for residential construction materials shows a 4.2% year-over-year increase through March 2026. Lumber prices have stabilized near $485 per thousand board feet after the wild swings of 2021-2023, but concrete and gypsum costs continue climbing at 6% annually. For a standard 2,200 square foot single-family home, total material costs now average $92,000 compared to $78,000 two years ago.
Interest Rate Trajectory and Builder Sensitivity
The Federal Reserve's monetary policy remains the single most powerful variable controlling housing starts volume. FRED data shows that each 50 basis point increase in the 30-year fixed mortgage rate eliminates approximately 100,000 potential homebuyers from qualification thresholds. At the current rate of 6.8%, roughly 38% of renter households that would like to purchase a home cannot qualify for a mortgage on a median-priced property.
J.P. Morgan Research projects that the Fed will implement two quarter-point rate cuts in the second half of 2026, bringing the 30-year fixed rate toward 6.3% by December. If this projection materializes, housing starts could see a 5 to 8% uptick in Q4 as builders respond to improving buyer qualification metrics. However, rate cuts are not guaranteed, and your project planning should model both scenarios—rates unchanged at 6.8% and rates declining to 6.3%—to bracket your revenue expectations.
Labor Cost Pressures on Builder Margins
BLS wage data for residential construction workers shows average hourly earnings of $32.40 in March 2026, up 5.1% from the same period last year. Framing crews in the Sun Belt are commanding $38 to $42 per hour, and experienced finish carpenters in coastal markets earn $45 to $55 per hour. These labor costs compress builder margins and influence the decision to start new projects.
The National Association of Home Builders estimates that labor accounts for 39% of total construction costs on a typical single-family home, up from 35% five years ago. This shift means that a builder who could profitably start a home at a sale price of $350,000 in 2021 now needs $385,000 to maintain the same margin percentage. In markets where median household income does not support that price point, starts decline because the math stops working for both builder and buyer.
Land Costs and Lot Availability
The other major cost input affecting starts projections is finished lot pricing. The NAHB reports that the average finished lot cost in 2026 is $98,000, representing 22% of the total home price in a typical suburban subdivision. In high-demand markets like Austin, Raleigh, and Boise, finished lots exceed $130,000. This lot premium directly reduces the number of entry-level homes that pencil out for builders, which suppresses starts in the most price-sensitive market segments.
Lot supply is constrained by two factors: municipal zoning restrictions that limit density, and infrastructure extension costs that make greenfield development expensive. Cities that have streamlined their entitlement processes—Houston, Nashville, and Jacksonville among them—see higher starts relative to demand because builders can move from land acquisition to vertical construction in 12 to 18 months. In contrast, markets with extended entitlement timelines of 24 to 36 months—much of California, the Northeast, and parts of Colorado—see suppressed starts regardless of demand signals.
Builder Sentiment and Forward Indicators
The NAHB/Wells Fargo Housing Market Index (HMI) provides a leading indicator of housing starts that typically foreshadows actual construction activity by two to three months. The March 2026 HMI reading of 42 sits below the breakeven threshold of 50, indicating that more builders view conditions as poor than good. This reading has declined from 47 in December 2025, suggesting that starts will face headwinds through the summer months.
Traffic of Prospective Buyers
The buyer traffic component of the HMI registered 28 in March, which is the weakest reading since October 2023. Low buyer traffic signals that builders are seeing fewer potential customers walking through model homes and attending open houses. When traffic drops below 30, builders typically slow their spec home starts and shift toward build-to-order contracts that reduce inventory risk.
For subcontractors and material suppliers, this traffic metric is a direct leading indicator of your order volume. A reading of 28 suggests that builders will pull 8 to 12% fewer permits over the next 90 days compared to a reading above 40. Adjust your labor scheduling and material purchasing accordingly rather than waiting for the actual starts data to confirm the slowdown.
Regional Builder Confidence Variations
Builder confidence varies dramatically by region. The South registered an HMI of 48 in March 2026, nearly at the breakeven level, while the Northeast recorded 31 and the Midwest posted 36. The West came in at 40, reflecting mixed conditions between strong demand in Sun Belt metros and weak activity in Pacific Northwest markets where affordability challenges are most acute.
These regional variations reinforce the importance of targeting your business development efforts toward the highest-confidence markets. A subcontractor operating in the South faces a fundamentally different demand environment than one in the Northeast, and your pricing, hiring, and equipment investment decisions should reflect this divergence.
Multifamily Starts: Detailed Sector Analysis
The multifamily segment deserves closer examination because it behaves differently from single-family under current market conditions. Census NRC data shows that multifamily starts (five units or more) reached 475,000 units SAAR in Q1 2026, a 3% increase from the prior year. This growth occurs despite broader market challenges because the rental demand fundamentals remain strong.
Apartment Demand Drivers
Rental demand is sustained by three structural factors: elevated mortgage rates pricing buyers out of homeownership, demographic shifts as millennials and Gen Z form new households, and immigration adding approximately 1.1 million new residents annually who initially enter the rental market. These demand drivers are not cyclical—they persist regardless of interest rate movements—which makes multifamily starts more resilient than single-family in the current environment.
Vacancy rates for professionally managed apartments sit at 4.8% nationally according to RealPage data, which is below the 5.5% threshold that typically triggers new development. Markets including Miami, Dallas, Phoenix, and Charlotte show vacancy rates below 4%, indicating acute undersupply that will sustain elevated starts through 2027 at minimum.
Construction Timeline and Absorption Risks
Multifamily projects take 18 to 24 months from groundbreaking to first occupancy for a typical 200-unit mid-rise building. Projects started in Q1 2026 will deliver units in late 2027 or early 2028. The risk for developers is that market conditions may shift during this extended construction period—rates could drop, encouraging renters to buy homes and increasing apartment vacancy, or a wave of new supply from projects started in 2024-2025 could saturate specific submarkets.
For contractors, these absorption risks translate to client caution on new project commitments. Developers are requesting guaranteed maximum price (GMP) contracts with more conservative contingency allowances rather than lump-sum fixed-price agreements. Your estimating team should prepare for GMP negotiations that include open-book cost reporting and shared savings provisions rather than traditional hard-bid scenarios.
Frequently Asked Questions
How much federal funding goes to housing starts projections 2026?
Industry analysts tracking housing starts projections 2026 report that 2026 has brought measurable shifts. With data showing 3%, the trend line suggests continued movement through the remainder of the year. Builders should factor this into both current bids and forward-looking project estimates.
Which states benefit most from housing starts projections 2026?
Market research on housing starts projections 2026 shows that geographic concentration matters significantly. With figures reaching 40% in key markets, the opportunities are substantial but location-dependent. States with strong population growth and infrastructure investment tend to see the highest activity levels.
What is the timeline for housing starts projections 2026 projects?
Compared to prior periods, housing starts projections 2026 has moved significantly. Current data showing 6.5% indicates the direction of the market, and contractors who adjust their strategies accordingly will be better positioned for profitability. Monitoring monthly updates from BLS and Census Bureau data releases is recommended.